

You don't need a wall of dashboards. Small teams get the most from a handful of customer support metrics, each tied to a clear decision: how fast you reply, how long issues take to close, where requests come from, who is carrying the load, and what customers keep asking about. Start with the 10 below, set targets from your own baseline, and look over your help desk reports together once a week.
That's the whole idea. The rest of this post covers how to read each number, what to do with it, and how to avoid measuring everything and changing nothing. ☕
Why fewer customer support metrics are better for small teams
Picture this. It's Monday morning, there are three of you, and someone opens the reports page of your help desk software. Forty charts. Pie charts, heat maps, a line that's gone up for reasons nobody can explain. Everyone nods, says 'interesting', and goes back to the inbox. Nothing changes.
I've seen versions of this more times than I can count, and it's rarely a lack of data. It's a lack of decisions attached to the data.
Here's the rule of thumb I like: every metric should map to a decision. If a number moves and you wouldn't know what to do about it, it's trivia. The decisions we care about sound like this:
- Do we need more cover at certain hours?
- Should we hire, or borrow help from product or sales during busy weeks?
- Is it time to write a help article?
- Do we need to change a rule, a template or a tag?
Watch out for vanity numbers too. A big total ticket count might feel impressive (or alarming), but on its own it doesn't tell you what to do next.
The 10 metrics fall into four groups. Speed covers first response time, resolution time, and first response time by channel. Quality covers CSAT, first-contact resolution and reopen rate. Volume and workload covers conversations by channel, workload per teammate and backlog. The last group is insight, which is really just your top conversation tags.

One practical note. If your live chat and email live in two separate tools, you're stitching together two sets of reports before you even start. A shared inbox (Sonny is one example) puts live chat and email in one place, so the picture is already combined and you can still filter by channel when you need detail.
Speed metrics: first response time and resolution time
Most teams start with speed, and I understand why. Salesforce's State of the Connected Customer report (2022 edition) found that 83% of surveyed customers expected to interact with someone immediately when contacting a company. That's a survey of stated expectations, not a measure of what customers actually tolerate, and it's a few years old now, so check the latest edition. It won't hand you a universal target, but it does explain why a slow reply can feel so personal.
Metric 1: First response time
First response time is how long it takes to reply to a customer's first message. Two tips for reading it well:
- Use the median, not just the average. One ticket that arrived at 5:55pm on a Friday can drag your average up. The median tells you what a typical customer experienced.
- Separate automatic acknowledgements from real replies. 'We've got your message' is useful, but it isn't a substantive first response, and your number should reflect when someone actually got help.
The decision it informs: coverage hours and auto-acknowledgements. If replies are slow at certain times, you might shift who's online when, or set an honest auto-reply that tells customers when to expect a human.
Metric 2: Resolution time (average and median)
Resolution time is how long it takes until an issue is marked resolved. It can include time spent waiting on the customer or another team, so decide up front how you'll treat that. Tools and teams define start, stop and business-hours rules differently, so write yours down and stick with it.
Long-tail tickets are the catch. A handful that drag on for weeks can make the average look dreadful even when most issues close quickly. Report the median alongside the average, and if you can, look at a tail measure such as the slowest 10% of conversations.
The decision it informs: where to dig. If first replies are quick but resolution is slow, look at ticket categories, handoffs and waiting-on-customer time rather than telling everyone to type faster.
Metric 3: First response time by channel
This isn't a new measure. It's Metric 1 split by channel, and the split matters. Customers expect seconds or minutes on live chat and hours on email. Blend the two into one number and you'll hide problems, because fast chat can mask slow email, or the other way round. View them side by side.
As a very rough starting point (these are my own rules of thumb, not published benchmarks), many small teams aim for chat replies within a few minutes during staffed hours and email replies within one working day. Begin there, then adjust once you've seen your own numbers.
The decision it informs: staffing or routing for a specific channel. If email is the slow one, maybe one person owns the email sweep at set times.
One gentle reminder: a fast but unhelpful reply isn't a win. Speed numbers always need a quality number standing next to them, so that's where we're heading next.
Quality metrics: CSAT, first-contact resolution and reopen rate
Quality is harder to measure than speed, but three simple metrics get you most of the way. Read them together rather than on their own.
Metric 4: Customer satisfaction (CSAT)
Keep the survey tiny. A thumbs up or thumbs down, or a 1 to 5 prompt, after a conversation is plenty. Then do the part people skip: read the comments.
A score tells you something happened. Comments tell you what. They also help you separate a poor support experience from frustration with the product or a policy you can't change. Report how many people responded alongside the score too, because ten responses and a hundred responses are very different stories, and people who answer surveys don't always represent everyone.
The decision it informs: which conversations to review, and which templates or policies need a second look.
Metric 5: First-contact resolution (FCR)
FCR is the percentage of issues solved in the first interaction, with no back-and-forth. Definitions vary a lot between tools, channels and teams, so decide what counts as an interaction and a resolution before you compare periods. A ticket marked 'solved' isn't always solved from the customer's side.
Because of that, I'd skip published FCR benchmarks. Channel mix, issue complexity and measurement method change the maths so much that your own trend is far more useful than anyone else's number. A sample check helps: read ten 'first-contact' tickets each month and see whether the customer really got what they needed.
This is where internal notes earn their keep. When a teammate can see the earlier chat, the customer's plan and what's already been tried, they don't have to ask the customer to repeat themselves. Shared context is one of the quietest ways to lift FCR.
The decision it informs: where to improve knowledge sharing, templates and help articles.
Metric 6: Reopen rate
Reopen rate tells you how often a 'solved' ticket comes back. It's a quiet signal. When it creeps up, answers may be closing tickets without fixing problems. The cause could be incomplete answers, closing too early, unclear instructions, or a recurring product bug.
A calculation caveat: dividing tickets reopened this week by tickets solved this week mixes two different groups, because many reopened tickets were solved in an earlier period. The cleaner method is a cohort. Take the tickets solved in a given week and count how many were reopened within, say, seven days. Whichever method you use, follow your help desk's documented definition and keep it consistent so trends are comparable.
Here's a small example. Say billing questions show a high FCR but also a high reopen rate. You read a handful of reopened cases and find agents answer the charge question but never explain what happens on the next invoice, so customers come back. You update the reply template and the help article, then watch whether reopens fall without CSAT slipping. That's a metric turning into a fix. (This is an illustrative scenario, not a published case study.)
The decision it informs: which answers, templates or product issues need fixing at the root.
Use low CSAT scores and reopened tickets to learn, not blame
Once a week, pull three to five low-scoring or reopened conversations and read them as a team. Ask 'what made this hard?' rather than 'who wrote this?'. Higher FCR isn't automatically good if it comes with more reopens or lower CSAT, so looking at all three, and at the actual conversations behind them, keeps you honest.
Conversation volume by channel
Metric 7: Total conversations, split by live chat and email
Volume is your demand signal. Track the total and the split between live chat and email over time, week by week rather than day by day, so you see the shape instead of the noise.
Spikes and quiet patterns tell you how to staff your live chat widget, which days are busiest, and what launches or campaigns do to your inbox. Here's a typical story. An e-commerce brand notices that live chat surges for a day or so after every email campaign goes out, mostly delivery and discount-code questions. Once they spot it, they schedule an extra person on chat for campaign days and add a short FAQ link to the campaign email. Same team, calmer Tuesdays.
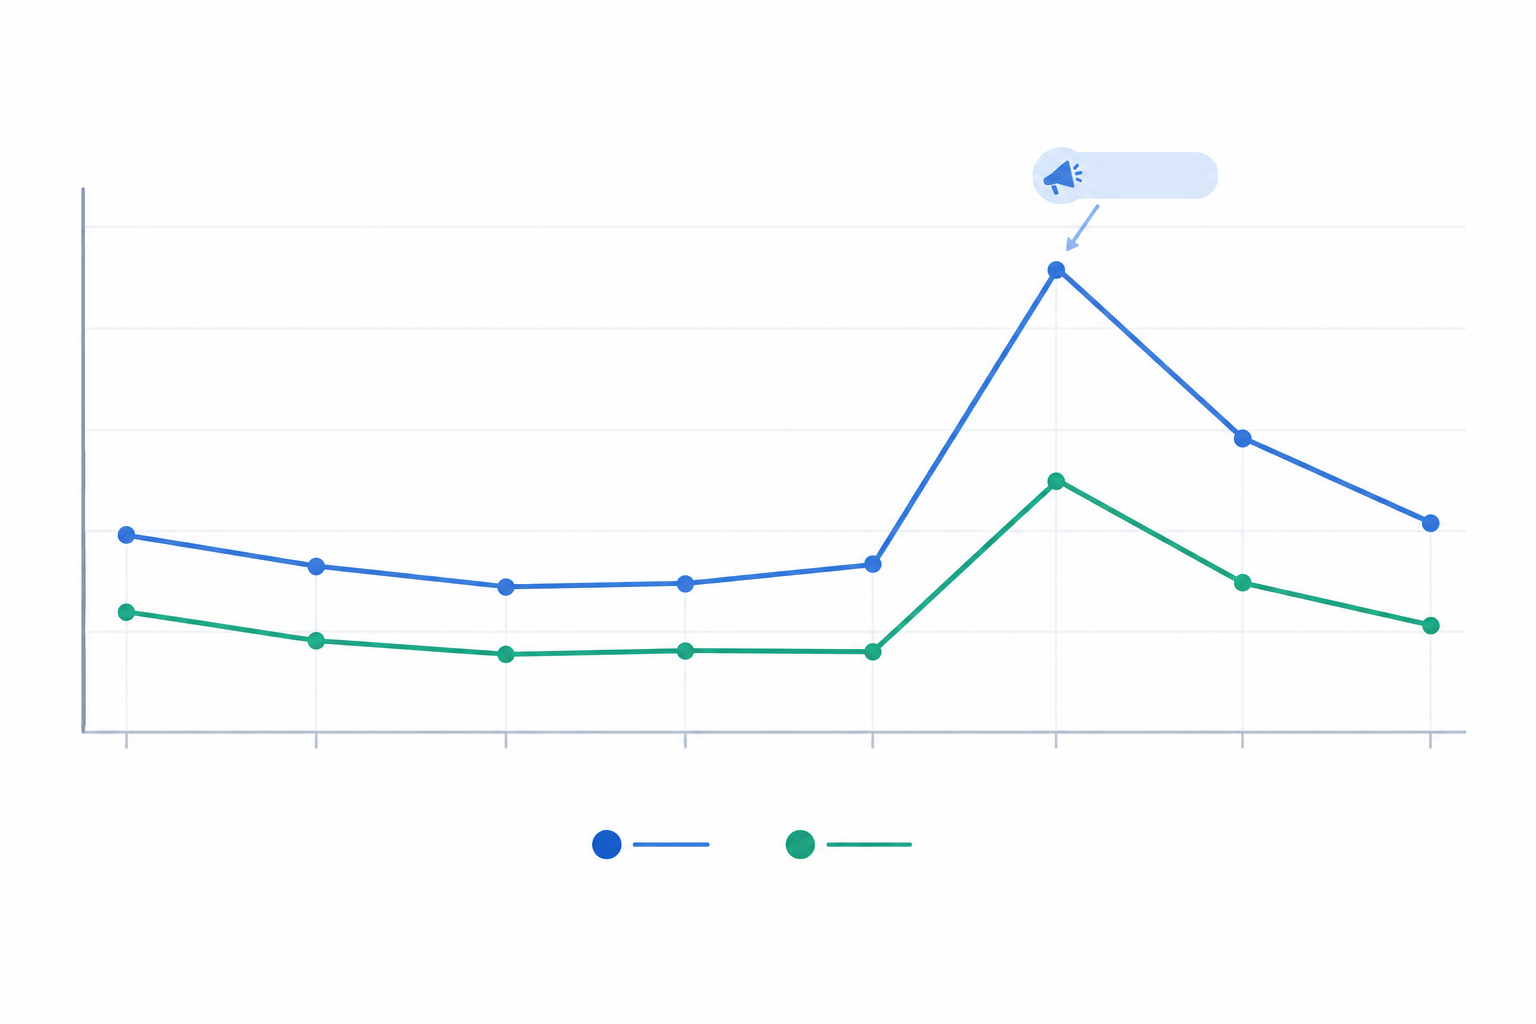
Should you ever nudge customers from one channel to another? Sometimes. If simple how-to questions flood chat, a clearer help article might help. If complicated account issues keep landing on chat, an email thread (with room for screenshots and time to investigate) may suit everyone better. But don't push people away from the channel they prefer just to make your numbers tidy.
Finally, pair volume with response time. If replies get slower exactly when volume rises, you've found a capacity problem. If they don't, you may have more headroom than you thought.
Workload by agent: use support metrics without micromanaging
Metric 8: Conversations handled and open tickets per teammate
This one makes people nervous, and I get it. Nobody wants to feel watched. So be clear from day one that this is a fairness and capacity check, not a leaderboard. Look at team-level patterns first, and treat per-person numbers as a prompt for questions rather than judgement.
Used well, it helps you spot a few things:
- Burnout risk, where one person is quietly handling far more than everyone else
- Bottlenecks, where open tickets pile up with someone who's out or overloaded
- Knowledge silos, like one person always getting billing questions, which means nobody else can cover them
When you discuss the numbers in a one-to-one, lead with curiosity. 'I noticed you handled a lot of refund conversations this month, what was that like?' goes a lot further than 'you're at 40% above average'. Context first, conclusions later. A high count might mean someone is brilliant at a topic, or it might mean they've been stuck with the hard ones.
The decision it informs: how to rebalance work, who to cross-train, and when to bring in extra help from product or sales during a peak.
Tag-based trends: find what customers keep asking
Metric 9: Top conversation tags
If I could only add one habit to a small team's routine, it might be tagging. Tags turn a pile of conversations into a list of reasons customers contact you: bug, billing, how-to, shipping, feature request, and so on. Watch how they move week to week.
A few ground rules:
- Keep the list short. Eight to twelve tags is plenty. Fifty tags means nobody picks consistently.
- Agree on definitions together. Is 'can't find my invoice' billing or how-to? Decide once, write it down.
- Turn recurring tags into action. Help articles, product fixes, canned replies and support automation rules all start here.
A quick example: a software team notices 'login issue' is their biggest tag for three weeks running. They dig in, find a confusing password reset email, and fix the wording. In the following weeks, login tickets drop noticeably, and the team gets time back for harder questions. That's the payoff that makes tagging feel worth the effort.
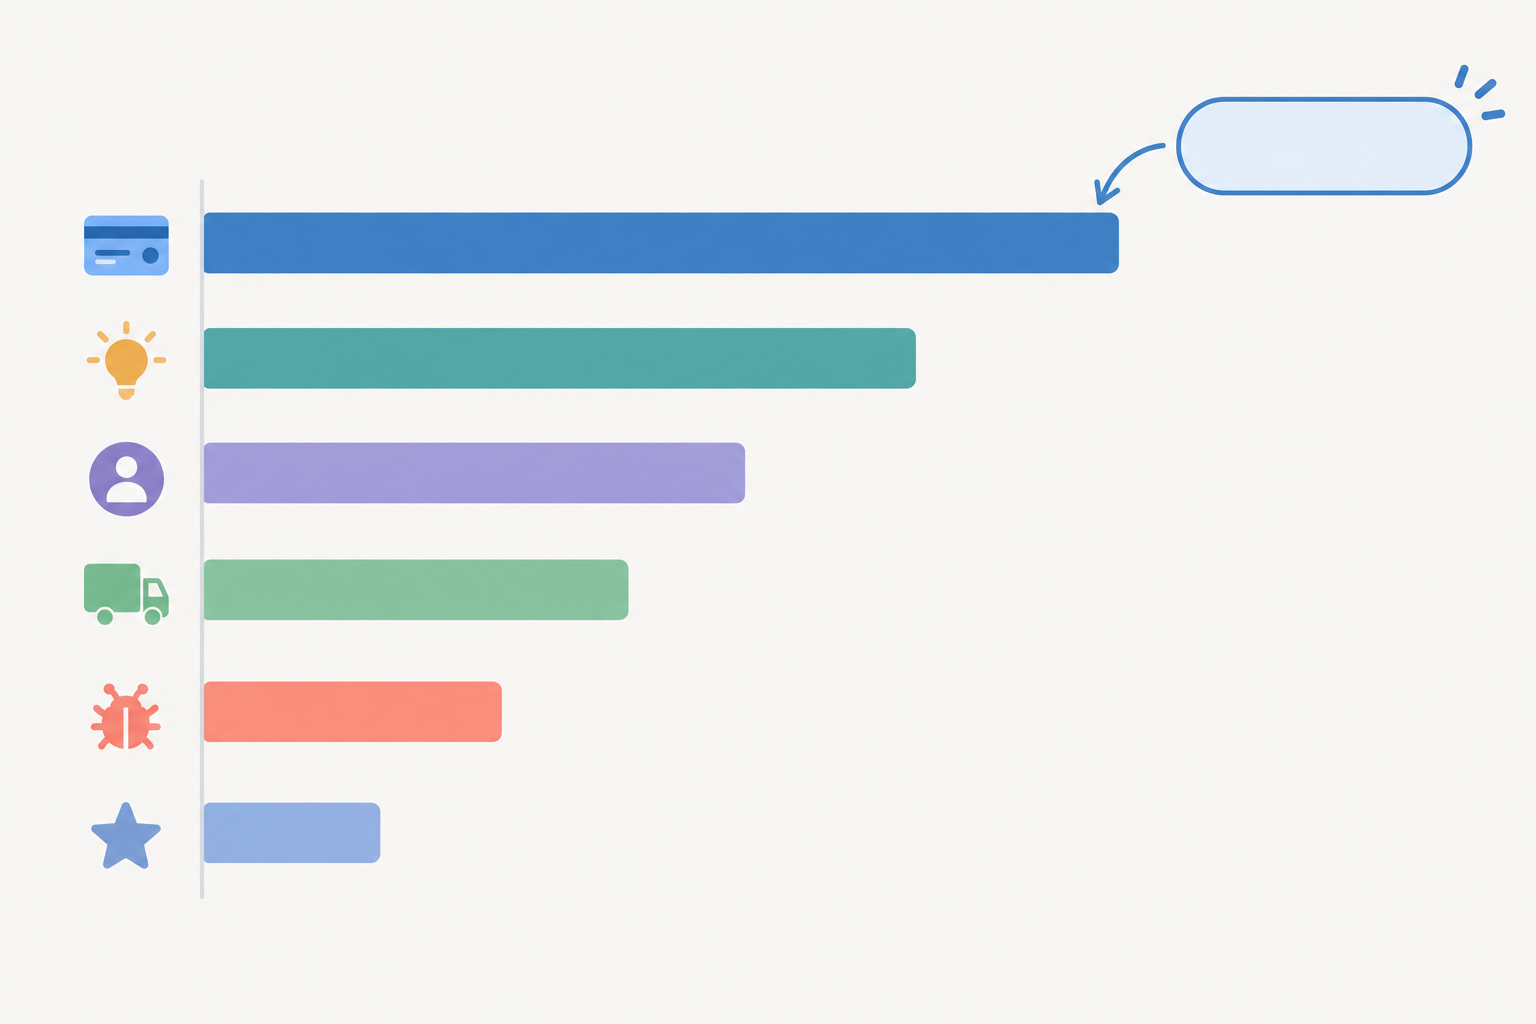
The decision it informs: what to write, fix or automate next.
Backlog and unresolved conversations
Metric 10: Open and unassigned conversations
Count how many conversations are still open, and how many have no owner, at the end of each day or week. For small teams, this is the early warning light. Response times can look fine while a quiet pile builds underneath.
The trick is separating two kinds of open conversation:
- Waiting on the customer: you've replied and you're waiting for details. Nudge them, then let them rest.
- Needs us: the ball is in your court. These are the ones that matter.
Tags or statuses make this split easy. And here's a simple daily habit: before you close out, take two minutes for an inbox-zero-ish check. Nothing unassigned, nothing waiting on you without a plan. It's tiny, and it prevents the Monday-morning surprise.
The decision it informs: who picks up what tomorrow, and whether you need extra hands this week.
How to set customer support metric targets for your team
Targets are where good metrics sometimes go sour, usually because someone picks a number from a blog post (even this one) and chases it. Here's a gentler approach.
- Collect two to four weeks of baseline data first. Don't set goals blind. You need to know what 'normal' looks like for you.
- Pick one or two metrics to improve, not all ten. Maybe first response time on email and reopen rate. Focus beats breadth.
- Set targets by channel and by coverage hours. Live chat during staffed hours is a different promise from email overnight. Publish your hours and your after-hours expectations so customers know what to expect.
- Make targets ranges, not hard lines. 'Most email replies within three to five working hours' is kinder and more realistic than 'always under 3 hours'. Revisit them each quarter.
- Be honest about trade-offs. Push speed hard and quality may dip. Push for perfect answers and replies may slow. Decide which you're protecting and say so.
A UK example: set support targets around bank holidays and working hours
If you're a UK team, your calendar shapes your numbers. Say you publish support hours of 9am to 5pm UK time, Monday to Friday, closed on bank holidays. Measure response times in working hours only, so a message sent on Good Friday doesn't count as 'slow' when it's answered on Tuesday morning after Easter Monday. Then say so in your auto-reply: 'We're closed until Tuesday and will reply first thing.'
Time zones work the same way. If you serve customers in the US or Australia, your 'overnight' queue might be their morning, so decide whether you'll offer a limited early or late check, or simply set expectations clearly. I'm not suggesting a UK benchmark here, since I haven't seen a reliable one. The point is that nobody should be measured against the impossible.
Where to find customer support metrics in your help desk reports
Here's the honest picture. Some of these metrics come straight from the built-in reporting in most help desk software. Others need tags, filters or a light manual routine. What's available varies by tool, so treat the table below as a general guide and check what your own reports show.
| Metric | Often a built-in report | Tags and filters | Manual tracking |
|---|---|---|---|
| 1. First response time | ✅ | ||
| 2. Resolution time | ✅ | ||
| 3. First response time by channel | ✅ | ✅ (filter by channel) | |
| 4. CSAT | ✅ (if surveys are enabled) | ✅ (simple follow-up prompt or tagged feedback) | |
| 5. First-contact resolution | ✅ (tag or filter) | ✅ (sample check) | |
| 6. Reopen rate | ✅ (in some tools) | ✅ (tag or filter) | ✅ (sample check) |
| 7. Conversation volume by channel | ✅ | ✅ | |
| 8. Workload per teammate | ✅ | ✅ (filter by assignee) | |
| 9. Top conversation tags | ✅ | ||
| 10. Open and unassigned conversations | ✅ (filter by status and assignee) |
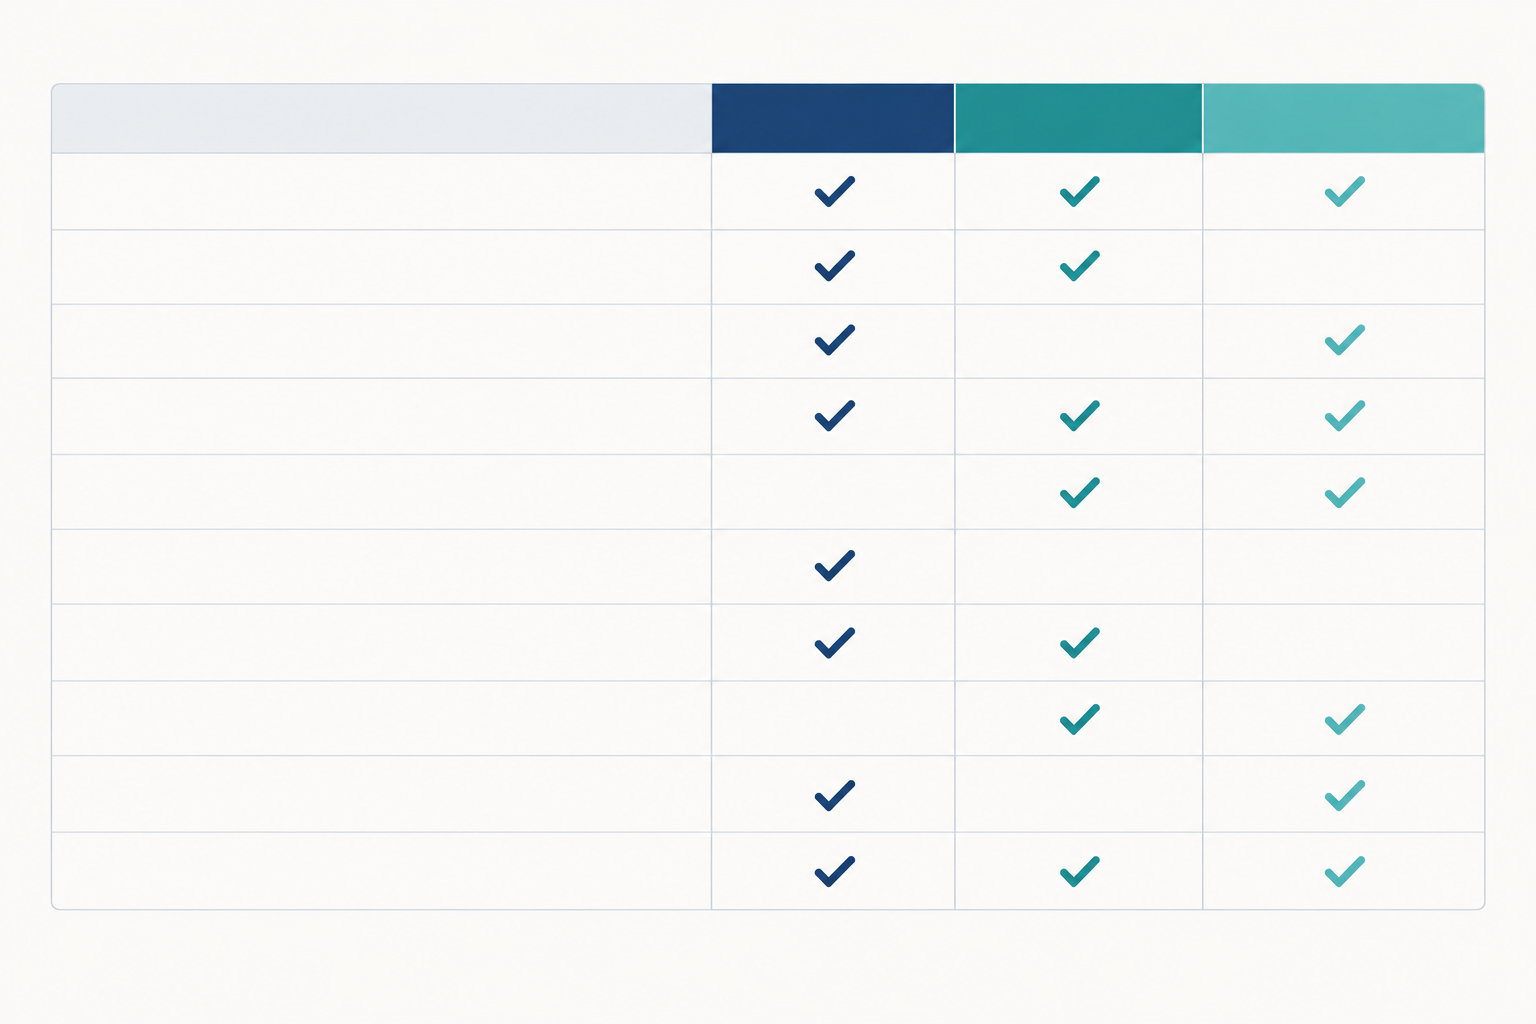
One tip that saves hours: build repeatable views. Save a filter for 'open and unassigned', another for each channel, another for your key tags. Then your weekly review means opening saved views, not rebuilding reports from scratch every Friday.
And if you're not on dedicated software yet, you can absolutely pull rough numbers from email timestamps and a spreadsheet. It just gets tedious fast, which is usually when teams start looking for a shared inbox.
Build a weekly help desk reports review habit
Metrics only help if someone looks at them. A short, steady routine beats a big annual audit every time. Here's a format that works for small teams:
- Keep it to 20 to 30 minutes, with a fixed agenda. Run through speed, volume, workload, tags and backlog, in that order, every week. Predictability makes it quick.
- Start with one win and one question, not a list of problems. 'Chat replies were quicker this week' and 'why did billing tickets jump on Wednesday?' sets a curious, friendly tone.
- Agree on one small action for next week, and write it down. Maybe a new canned reply, a tag clean-up or an extra pair of hands on campaign day. One action done beats five intentions.
- Rotate who leads. If the same manager presents every time, it feels like a report card. When teammates take turns, it becomes a shared habit.
- Zoom out monthly. Look at the trends across four weeks, and ask whether your targets still fit. Seasonal peaks, product launches and new hires all shift what's realistic.
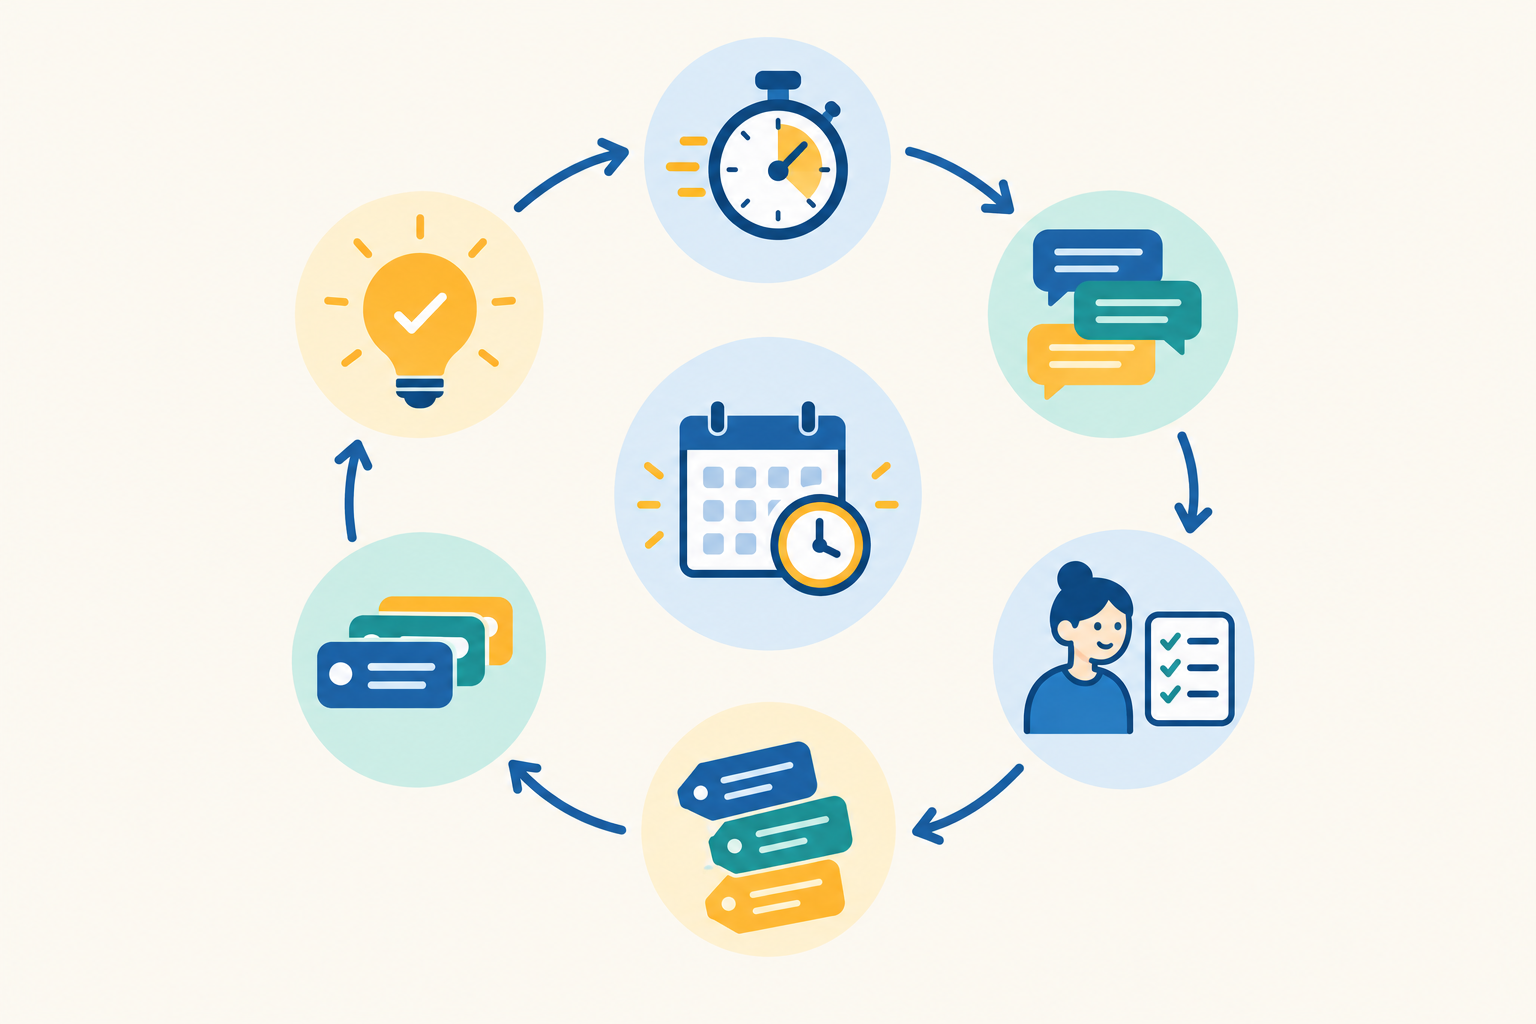
What a weekly customer support metrics review might look like
Here's a compact, made-up example. Email first response time is steady and chat is quicker, but billing tags doubled on Wednesday and three billing tickets were reopened. You read those three and spot the same missing explanation about invoice timing. Your one action for next week is to update the billing template and add a line to the help article. Next Friday, you check whether reopens dropped. That's the whole loop.
If you remember nothing else, remember this: small, steady attention is what moves the needle. 💛
Frequently asked questions about customer support metrics
Which customer support metrics matter most for tiny teams?
If you only track three, start with first response time, resolution time and conversation volume by channel. They show how fast you reply, how long customers wait for answers, and where demand comes from. Add tag trends and workload per agent as soon as you have a few weeks of data.
How do I set targets for customer support metrics?
Collect two to four weeks of baseline data, then choose one or two metrics to improve. Set targets by channel and coverage hours, use a realistic range rather than a rigid threshold, and review your targets regularly as demand and team capacity change.
How do I use help desk reports without micromanaging my team?
Look at team-level patterns first and treat per-agent numbers as a prompt for questions, not judgement. Share the reports openly, agree on what the numbers mean in advance, and use them to rebalance workload or fix processes rather than to rank people.
Do I need separate reports for live chat and email?
You should be able to see them separately, because customer expectations differ. Chat is usually judged in seconds or minutes and email in hours. A shared inbox lets you view both together for the full picture and filter by channel when you need detail.
Where do I find customer support data if I'm not using dedicated software yet?
You can pull rough numbers from email timestamps and a simple spreadsheet, but it gets tedious fast. Customer support software with a shared inbox, tags and built-in reporting makes response times and volume available automatically. If you'd like to try one, check the current trial terms on the Sonny website.