
Support reporting metrics that actually matter for small teams
If you've ever opened a customer support dashboard and felt your stomach drop at the sheer number of charts staring back at you, I want you to know something first: it's not you. It's the dashboard.
Here's the honest truth. Small support teams don't need thirty metrics to run a great operation. For most teams starting out, four support reporting metrics will get you remarkably far: first response time, resolution time, conversation volume by channel, and individual agent workload. Track these weekly, keep the process simple, and you'll spot problems before your customers even have to point them out. This isn't the only reporting framework that works, but it's a solid, low-effort starting point, and you can always add to it as your team and your questions grow more complex.
I know that's a bold claim in a world where every piece of customer support software wants to hand you a dashboard with twenty widgets on it. So let's talk about why that happens, and then let's build something that actually works for a team your size, wherever you're based and whatever hours you cover.
Why metrics overload hurts small teams
Most help desk software on the market was built with enterprise support organisations in mind: teams with dedicated analysts whose entire job is to slice data fifteen different ways before lunch. If you're running support with three or four people who are also answering tickets, testing features, and probably fielding a Slack message from sales right now, that same dashboard becomes a liability instead of a tool.
To be fair, there are legitimate reasons a small team might need more than four metrics. If you're bound by contractual SLAs, operate across multiple time zones, or handle regulated data, your reporting needs will look a bit different. But for most small teams without those constraints, more dashboards rarely mean more clarity.
When you're staring at twenty-plus metrics, you don't get clarity. You get decision paralysis. Which number matters today? Is a 3% dip in satisfaction worse than a rising backlog? Should you panic about a metric trending down, even though you're not entirely sure what it measures or why?
The goal here isn't more data. It's the right data, reviewed consistently, by people who can actually act on it. For a small team, that means metrics that fit comfortably into a 15-minute Monday morning check-in, not a quarterly business review with slide decks and a facilitator.
So let's strip it back to four customer support metrics that genuinely move the needle, and be precise about how to measure each one.
The four support reporting metrics small teams need
1. First response time: measure the first human reply
What it is: First response time (FRT) measures the time between a customer's initial message and the first human reply. An automated "we got your message!" doesn't count. Neither does a chatbot greeting. What counts is the moment a real person engages with the actual problem.
Why it matters: This is the metric customers feel most viscerally. Before they know if you've solved their problem, they know how long they waited to hear from a real person. That wait shapes their entire impression of your support, fair or not.
How to calculate it properly: Decide upfront whether you're measuring calendar hours or business hours. If your team covers 9-to-5 and a customer messages at 11pm, calendar-hour FRT will look terrible even if you replied the moment you opened up shop. Most small teams get more useful numbers by measuring against their actual service hours, not the full 24-hour clock.
Why does the human-versus-automation distinction matter so much? Because it's tempting to let automation make your numbers look better than your actual service. If your reported FRT is five minutes but that's just an auto-reply, you're measuring the wrong thing entirely. The metric that matters is how long customers wait for someone who can genuinely help them.
Benchmarks vary quite a bit by channel, and that's worth internalising early. Live chat customers expect near-instant replies: minutes, sometimes seconds. Email customers are more patient, but "patient" usually still means same-day, not next-week. Treating both channels with one blended target is a mistake I see small teams make constantly. It's more useful to set a channel-specific promise: fast for chat, reasonable for email, and measured separately so you know which one needs attention.
A few reporting habits worth adopting:
- Track median FRT, not just average. One delayed ticket can skew an average badly, making your whole week look worse (or better) than it actually was.
- Watch the 90th percentile too. This tells you about your worst-case waits, the slowest 10% of replies, which is often where customer frustration actually lives, even when your median looks fine.
- Segment by channel and priority. A spike in FRT during a product launch week tells a very different story than a slow Tuesday with no clear cause.
Here's where clear ownership earns its keep. One of the most common, and most avoidable, causes of slow response times isn't lack of staff. It's the classic "I thought Sarah was handling this" problem. A message sits untouched because two people assumed someone else grabbed it, or because it got buried in a personal inbox nobody else could see. When live chat and email conversations live in one shared inbox with clear assignment rules and visible ownership, that particular flavour of chaos mostly disappears. Nothing quietly slips through the cracks while two agents assume the other has it covered.
Speed matters to customers. That much is well established in customer experience research, even if the exact percentages you'll see quoted vary by study and sector. What matters more than any single statistic is this: FRT isn't a vanity metric. It's foundational, and it's worth measuring properly rather than gaming with automated replies.
2. Resolution time: track how long it takes to solve an issue
What it is: Resolution time measures how long it takes to fully close out a customer's issue, from their first message to the moment it's genuinely resolved. That might take one exchange. It might take five, with the customer sending screenshots, waiting for a fix, and following up again.
A few definitions worth pinning down before you start tracking this one:
- First resolution vs. final resolution. If a ticket gets reopened three days later because the fix didn't hold, does that count as a new resolution time or an extension of the original one? Most teams get cleaner data by tracking reopen rate separately rather than blending it into resolution time.
- Time waiting on the customer shouldn't count against you. If you've replied and you're waiting two days for the customer to send a screenshot, that clock time isn't really "your" resolution time. Many help desk tools let you pause the clock during customer-waiting periods, so it's worth checking whether yours does.
- Median and percentile, same as FRT. A single complex ticket that took a week will badly distort an average across a small team's weekly volume.
Why it matters: Replying fast and actually solving the problem are two very different achievements, and small teams sometimes optimise for the wrong one. I'd argue resolution time matters just as much as, if not more than, first response time for a lot of teams. A customer who waits 20 minutes for a first reply but gets a complete, correct answer will often forgive that wait. A customer who gets a lightning-fast reply that doesn't actually solve anything, and then has to go back and forth five more times, can walk away less satisfied, even though the FRT looked great on paper.
So why does resolution time balloon? In my experience with small teams, it's almost always one of three things:
- Unclear ownership. The ticket bounces between agents because nobody's sure who's actually driving it to completion.
- Missing context. An agent picks up a conversation without knowing what was already tried, so they ask the customer to repeat information they've already given.
- Ping-ponging between agents or tools. The issue gets escalated, forwarded, or discussed in a separate Slack thread that the customer never sees resolved in real time.
This is exactly where internal notes and tagging earn their place in your workflow. When context lives in the same thread as the conversation, not scattered across five tools, an agent can pick up a ticket cold and see what's been tried, what the customer said, and what the next step should be. That alone can plausibly shave meaningful time off your average resolution, though the actual impact will depend on how disorganised your current process is to begin with.
3. Conversation volume by channel: understand demand
What it is: The number of new conversations arriving through each channel (live chat, email, and any others you support), tracked separately rather than lumped into one "total conversations" figure. Worth defining upfront: does a "conversation" mean a new thread, or does every follow-up message count separately? Most teams get more useful numbers counting new conversations, since follow-ups are really part of resolving one issue, not new demand.
Why it matters: This metric doesn't get talked about enough, and I think that's a mistake, because it reveals staffing and workflow gaps that the other metrics simply can't show you. Tracking live chat and email volume separately lets you see patterns you'd otherwise miss entirely. Maybe live chat spikes hard between 11am and 2pm when customers are actively using your product, while email quietly piles up overnight and greets you first thing every morning. Without separating the two, you'd never notice that your team is understaffed for the midday chat rush while overcorrecting for a slower email queue.
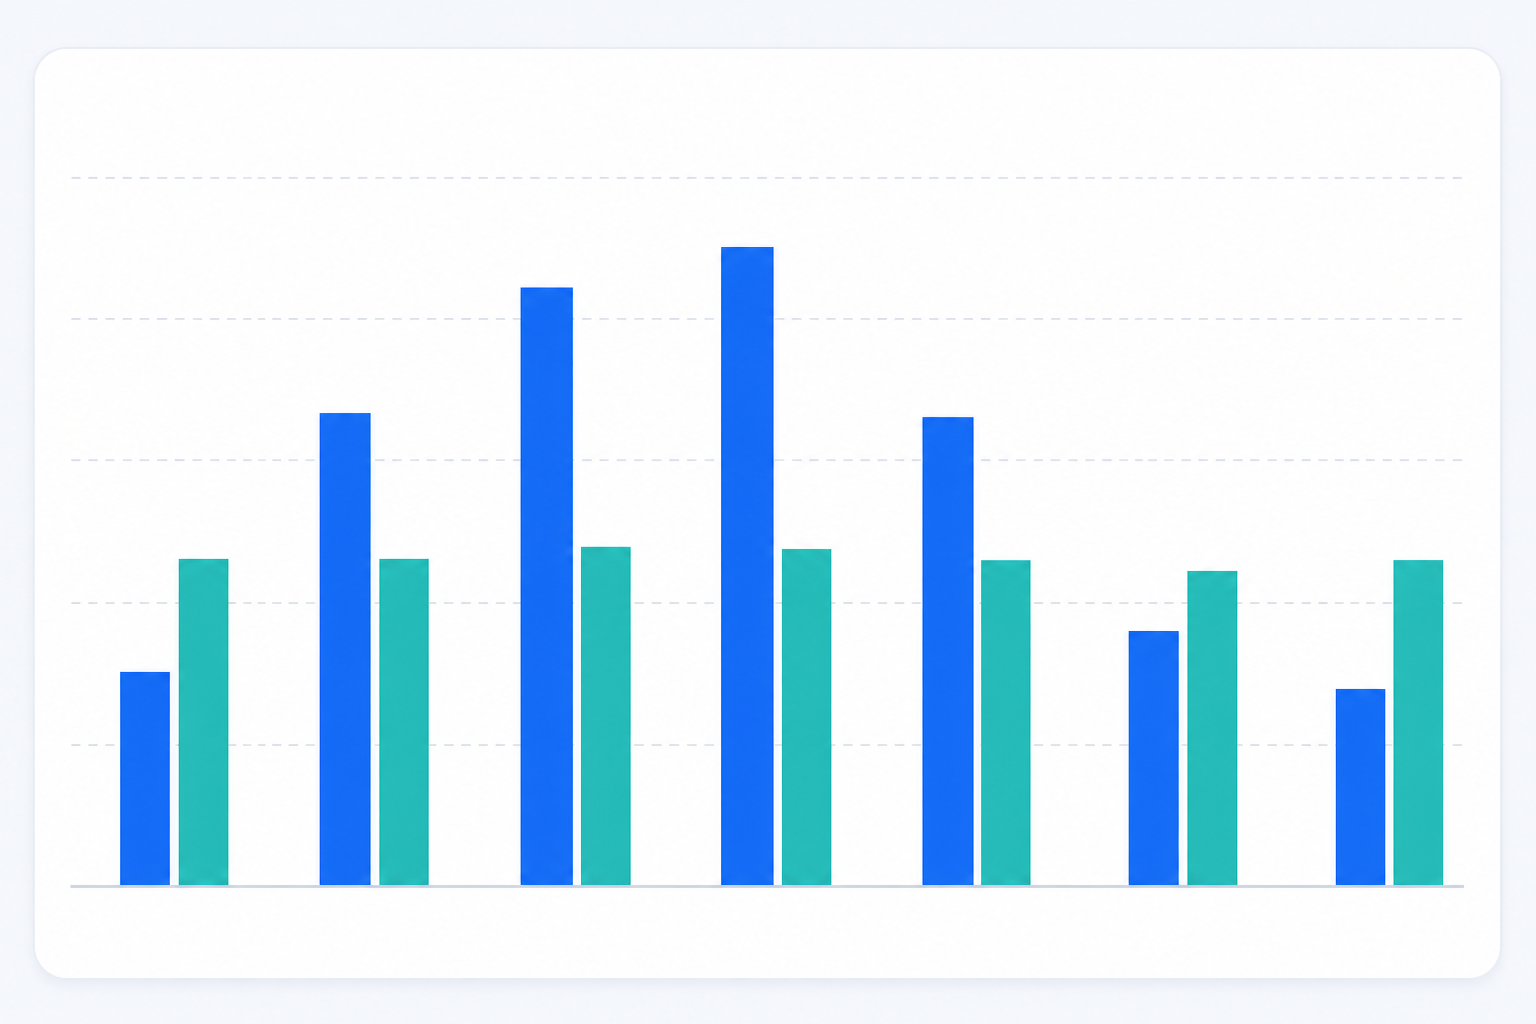
One caveat worth flagging: raw volume alone doesn't tell you about complexity or effort. Ten quick "where's my invoice" chats aren't the same workload as ten conversations involving a broken integration. Use volume to spot patterns and staffing gaps, but pair it with resolution time to understand actual effort.
This data also helps you decide where to invest limited time and budget. If chat volume is climbing and email is flat, maybe it's time to rethink where your live chat widget appears on your site, or adjust staffing to cover peak hours. If email keeps growing, a few well-written templates for common questions could free up hours each week.
The trap to avoid here is treating every channel identically. Customer expectations differ by channel, and so should your workflows. Chat is inherently synchronous and urgent-feeling; email is asynchronous and a bit more forgiving. Reporting on volume by channel keeps you honest about where the actual pressure is building, instead of guessing based on whichever channel felt busiest that particular day.
4. Individual agent workload: support team capacity
What it is: This one needs a precise definition, because "workload" can mean several different things depending on what you're actually counting: open conversation count (how many tickets are currently assigned to someone), incoming volume (how many new conversations they're receiving per day), or active handling time (how long they're actually spending per conversation). For most small teams, tracking open conversation count alongside resolution time per agent gives the clearest picture without overcomplicating things.
Why it matters: I want to be really clear about something: tracking individual agent workload isn't about surveillance. It's about catching burnout and imbalance before it becomes a resignation letter or a string of rushed, low-quality replies.
Here's what quiet drowning usually looks like: one agent's queue keeps growing while their response quality slowly slips, not because they're careless, but because they're stretched too thin to give each conversation the attention it needs. Meanwhile, another teammate has capacity to spare but nobody's noticed, because nobody's actually looking at the workload split.
Signs worth watching for:
- One agent consistently has a noticeably higher open-conversation count than teammates
- Response quality (not just speed) starts slipping for a specific person
- Someone's resolution times creep up week over week while others stay flat
- A team member stops taking on new conversations voluntarily, even when others are swamped
When you spot an imbalance, the fix doesn't always need to be dramatic. Sometimes it's redistributing a handful of open conversations for a day or two. Sometimes it means temporarily pulling in a teammate from another function to help clear a backlog, or cross-training someone on a channel they don't normally cover. What matters is that workload data actually leads to a conversation and a decision, rather than sitting in a spreadsheet unread.
Use this data for team collaboration, not blame. The point of watching workload isn't to catch someone underperforming. It's to redistribute conversations before burnout sets in and to have an honest, supportive conversation about capacity.
How to build a simple weekly support report
Okay, so you've got your four metrics, plus a rough sense of how to calculate each one properly. Now what? Here's a straightforward process that takes about 15 minutes and actually gets used, week after week, instead of becoming another abandoned spreadsheet.
- Set a recurring 15-minute slot every Monday morning. Same time, same day. Consistency matters more than perfection here.
- Pull last week's numbers from wherever your reporting lives. If your support tool requires exporting data into three different spreadsheets first, that's a sign your tooling is working against you, not for you.
- Flag anything that moved meaningfully, using both percentage and absolute numbers. A 20% swing is a reasonable trigger to look closer, but be careful with small volumes: if your team handles five conversations a day, going to six is a 20% increase that means almost nothing. For low-volume teams, also watch absolute changes (like "FRT jumped from 10 minutes to 40") and rolling averages over two or three weeks rather than single-week snapshots.
- Discuss one root cause and one action item as a team, not ten. Small teams don't need a ten-point action plan every week. They need one clear thing to fix and one person accountable for fixing it.
- Save the report in a shared doc. A single week's numbers don't tell you much on their own. Months of consistent weekly snapshots will show you trends that a one-off glance never could.
A simple one-page template can look like this:
| Metric | This Week | Last Week | Target | Action Needed? |
|---|---|---|---|---|
| First Response Time (median) | ||||
| Resolution Time (median) | ||||
| Conversation Volume (chat / email) | ||||
| Agent Workload (open convos, per person) |

Support metrics to ignore, at least for now
Part of building a lean reporting habit is knowing what to leave off the page, on purpose, not by accident. Here's what I'd suggest most small teams set aside initially, with a couple of caveats:
- Detailed CSAT breakdowns, if your volume is still low. A handful of survey responses each week isn't statistically meaningful on its own, and chasing tiny fluctuations will drive you a little spare. That said, don't ignore CSAT entirely. Read the written comments when they come in, and track a rolling monthly average rather than a weekly one. Qualitative signal from a handful of responses can still be useful even when the number isn't.
- Complex SLA tiering. Multi-tier service level agreements are genuinely useful for large enterprise support organisations juggling different contract levels. For a five-person team without contractual obligations, they usually add complexity without adding insight.
- Vanity metrics like "total tickets closed." A number without context on complexity tells you almost nothing. Closing 200 simple tickets isn't the same accomplishment as closing 50 truly difficult ones.
- Anything that takes longer to interpret than to act on. If you need a 20-minute meeting just to understand what a metric means, it's probably not earning its place on your weekly report yet.
One honest caveat about the four-metric framework as a whole: it's built around speed and workload, and it doesn't include an explicit quality check by default. If you notice FRT and resolution time both looking great but customers still seem unhappy, that's your cue to bring a lightweight quality signal back in: occasional CSAT sampling, a reopen-rate check, or just reading a handful of transcripts each week. Speed without quality is its own kind of problem.
You can always add metrics back later as your team grows and your questions get more sophisticated. But starting simple, and staying simple, is what actually gets a report used consistently instead of quietly abandoned by week three.
Frequently asked questions about support reporting metrics
What support reporting metrics should a small team track?
A solid starting set is four: first response time, resolution time, conversation volume by channel, and individual agent workload. These give you a picture of speed, quality, demand, and team health without requiring a data analyst to interpret them, though teams with specific contractual or regulatory needs may need to track more.
How often should I review support performance data?
Weekly is a good default for most small teams. Daily checks create noise and overreaction to single conversations, while monthly reviews let problems fester too long before you notice a trend. If your volume is very low, consider a rolling two-week view instead, since weekly numbers may be too noisy to act on.
What's the difference between first response time and resolution time?
First response time measures how long it takes a real human to acknowledge a customer's message. Resolution time measures how long it takes to actually solve their problem, which might take several back-and-forth exchanges after that first reply. Be sure to define whether you're using business hours or calendar hours, and whether reopened conversations count as new resolutions or extensions of the original ticket.
Do I need separate metrics for live chat and email?
You don't need entirely separate metric sets, but you should track volume and response times by channel since customer expectations differ: chat users expect near-instant replies, while email users are more patient but still expect a same-day response in most sectors.
How can customer support software improve these metrics without adding headcount?
A shared inbox can reduce the time lost to inbox-switching, duplicate replies, and unclear ownership. When live chat and email conversations live in one place with tagging and internal notes, agents are generally better positioned to resolve conversations faster, since they're not hunting for context across five different tools. The actual improvement will vary depending on how fragmented your current setup is.
Good reporting isn't about how much you measure. It's about whether the numbers on your screen actually change what you do on Monday morning. Keep it to a handful of well-defined support reporting metrics, keep the habit weekly, and you'll spend a lot less time drowning in dashboards and a lot more time actually helping customers. 🙂