
Help desk software metrics for small teams: what to track and how to improve
If you're running support for a small team, here's the honest truth: you really only need to track three things well in your help desk software. First response time. Resolution time. And conversation volume by channel. That's it. Everything else on a fancy reporting dashboard is noise until you've got those three dialled in.
I say this because I've watched too many small teams get talked into tracking a dozen metrics they saw in a blog post written for a 200-person support organisation. Customer satisfaction scores, first contact resolution rate, agent utilisation, escalation rate, sentiment analysis... it's a lot. When you're a team of three people juggling live chat and email without any formal reporting in place, that list is overwhelming before you've even opened the dashboard.
This matters just as much if you're running support out of London as it does anywhere else, but a couple of things are worth flagging upfront. Most benchmark advice online assumes US working patterns and doesn't account for things like bank holidays, split time zones if you're supporting customers abroad, or the simple fact that "business hours" means different things depending on how your team is set up. We'll come back to that in the benchmarks section.
Let's break down which help desk software metrics matter most, how to read them without getting lost, and how to turn the numbers into a habit your team actually keeps up with. The same principles apply whether you're using dedicated help desk software or broader customer support software with reporting built in.
Which help desk software metrics matter most for small teams?
When you're small, every hour spent staring at a dashboard is an hour not spent talking to customers. So the goal isn't to measure everything. It's to measure the few things that tell you whether customers are being taken care of and whether your team has the bandwidth to keep it that way.
Here's what I'd focus on first:
- First response time (FRT). This is how long a customer waits before hearing anything back from your team, even if it's just "got it, looking into this now." It's less about solving the problem and more about making someone feel heard.
- Resolution time. This tracks how long it actually takes to close out the issue, start to finish. It's the metric that tells you whether your team is actually fixing things, not just replying to them.
- Conversation volume by channel. Are live chats or emails taking up more of your team's attention this week? Volume shifts are often the first sign that something's changing, whether that's a product bug, a marketing campaign driving traffic, or a seasonal spike.
One caveat worth sitting with: volume on its own tells you how many conversations came in, not how much effort they took. A channel with fifty quick "where's my order" emails can be lighter work than a channel with five gnarly billing disputes. Use volume as a demand signal, then pair it with how long those conversations actually took to resolve before you draw conclusions about where your team's time is going.
Why stop at three metrics? Because a 3-person team chasing everything on a dashboard ends up in analysis paralysis. You'll spend your Monday morning meeting debating what "agent utilisation" even means for your context instead of talking about the customer who's been waiting since Friday. Start narrow. You can always add metrics later once these three feel like second nature.
One practical note here: if your live chat widget and your email inbox are two separate tools, someone on your team is probably manually combining numbers from both just to get a full picture. Some help desk software (Sonny included) pulls all three metrics from a single shared inbox so you're reading one report instead of reconciling two. That's a nice-to-have, not the point of this article. The metrics matter regardless of which tool you use to see them.

First response time vs. resolution time: what's the difference?
These two metrics get lumped together a lot, but they're measuring completely different things, and mixing them up can give you a false sense of how well your team is actually doing.
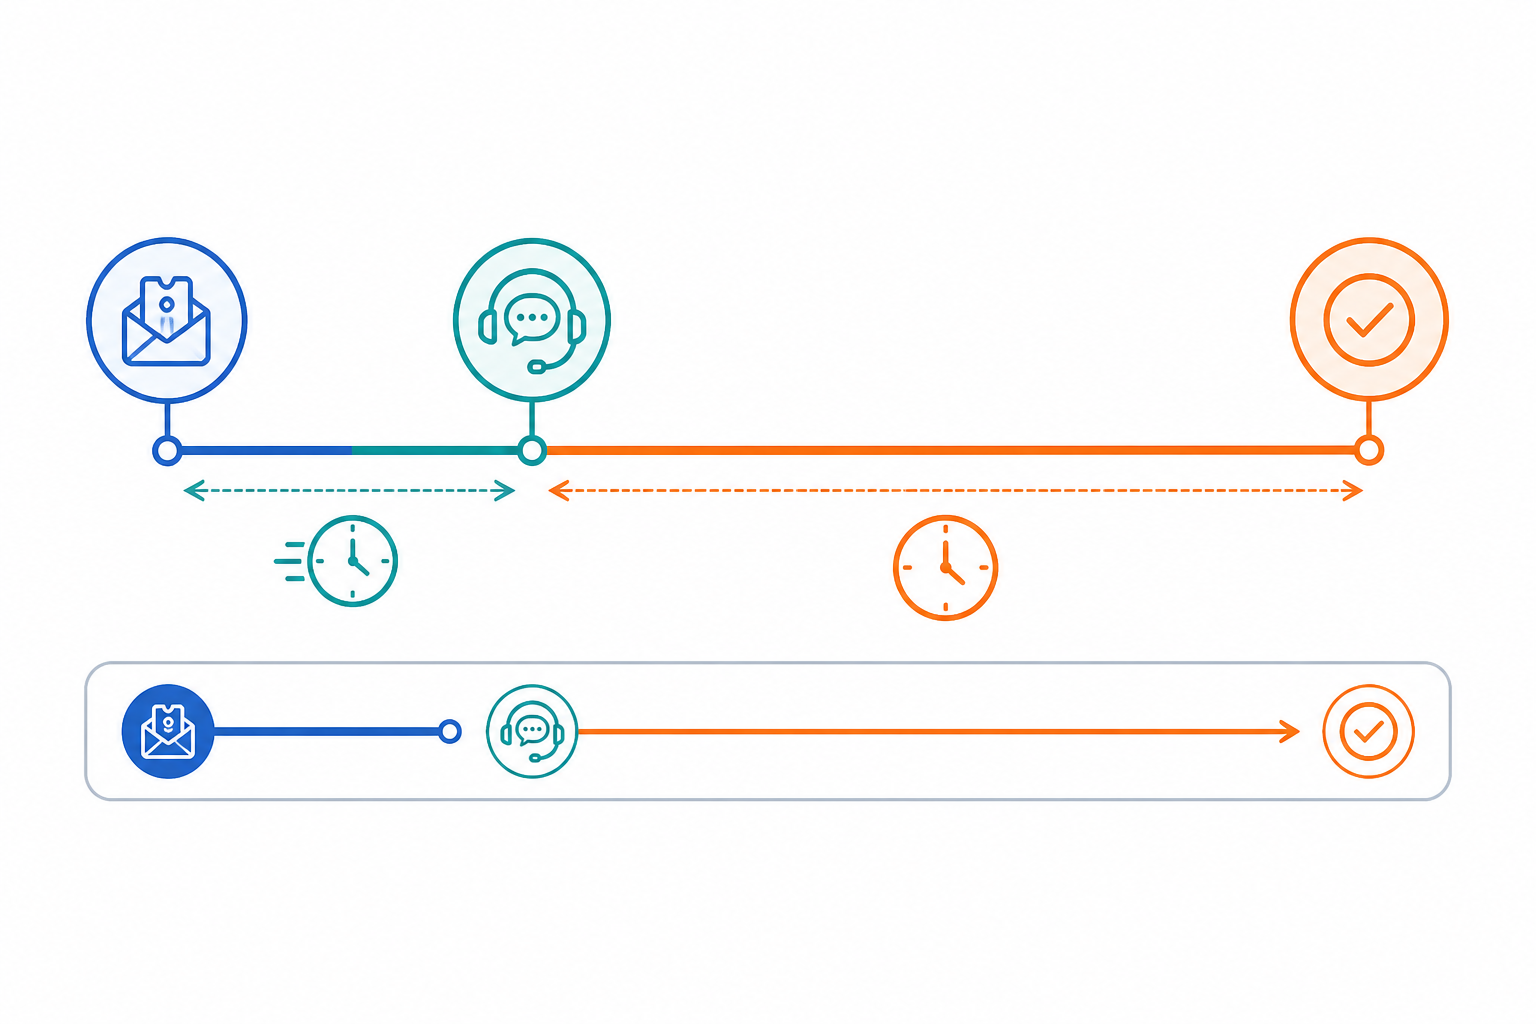
First response time is about speed of acknowledgement. It answers the question: how long did the customer sit there wondering if anyone even saw their message? Resolution time is about speed of actually fixing the problem. It answers a very different question: how long until this person's issue was genuinely solved?
Before you compare numbers, check how they're being measured. Most help desk software gives you a setting to define this, so it's worth checking rather than assuming. A few things to confirm:
- Calendar hours or business hours? A ticket that comes in at 11pm on a Friday and gets answered at 9am Monday looks like a 10-hour disaster in calendar time but a same-morning response in business-hours time. These give wildly different pictures, so know which one your reports are using.
- Do automated replies count? An instant "we got your message" bot reply will make your FRT look brilliant even if no human looks at the ticket for hours. Some tools let you exclude bot replies from the FRT calculation and measure time to first human response separately, which is usually the more honest number.
- What happens when a ticket reopens? If a customer replies to a "resolved" ticket three days later, does that restart the resolution clock or does it count as a fresh conversation? Different tools handle this differently, and it changes your average quite a bit.
Here's a scenario that plays out constantly in small support teams. A customer emails about a billing issue. Your auto-acknowledgement (or a quick human reply) goes out in two minutes. Great, right? First response time looks fantastic. But the actual refund doesn't get processed for three days because it needed sign-off from someone who was out of office, or the ticket got buried under new chat conversations. That's a stellar FRT paired with a pretty rough resolution time. If you only look at the first number, you'd think support was crushing it that week.
This is exactly why tracking both together matters more than either one alone. A fast first response without a fast resolution just means you're good at saying "we'll get to it." A team that nails both numbers is the one that's actually building trust, because customers aren't just being heard. They're being helped.
I'd also gently push back on the idea that a quick automated reply counts as a real "first response" in the way that matters most. It helps with the metric, sure, but customers can tell the difference between a bot saying "we got your message" and an actual person engaging with their specific problem. Both matter, but don't let a good FRT number lull you into thinking the work is done.
How to read help desk team performance reports and spot bottlenecks
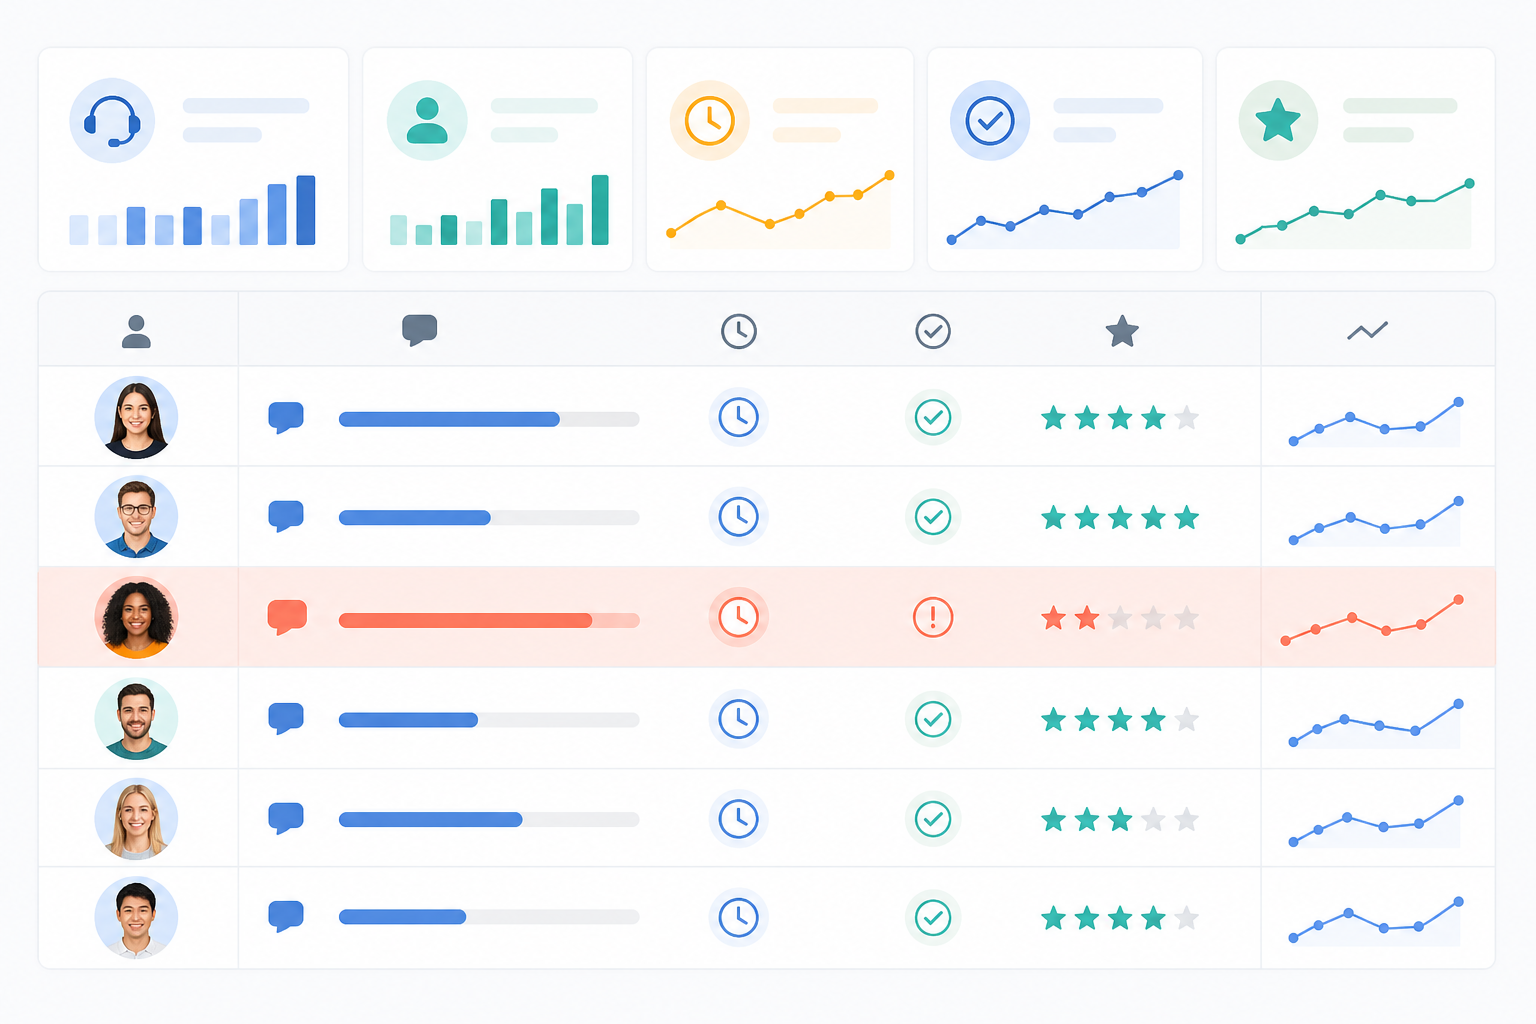
Once you're tracking these numbers, the real value comes from spotting patterns. Specifically, the patterns that point to something fixable. A word of caution before we get into it: none of these are automatic diagnoses. Treat them as starting hypotheses to check against what you actually know about your team, not conclusions.
Tickets sitting untouched for hours. This is often a tagging or filtering problem rather than a workload problem, but check both before assuming. If a conversation falls into a queue nobody's watching, it can sit there for a full day even if your team has plenty of capacity. Before you conclude it's a filter issue, confirm: was the team actually at capacity that day? Was it outside business hours? Check your filters, but also check your staffing coverage before you assume you need to hire.
Response time gaps between channels. Live chat should generally be close to instant since customers are sitting there waiting. Email can reasonably be slower. But if your chat responses are averaging 20 minutes, that gap is worth investigating. It might mean chat notifications aren't reaching the right person fast enough, or it might mean your team was mid-conversation on other chats and genuinely couldn't get there sooner. Look at concurrent chat volume before assuming it's a notification issue.
One agent consistently slower than the rest. Before you read this as a performance issue, ask a few questions. Are they newer and still need training? Are they the one who always gets the gnarly, complicated tickets because they're good at them? Are they covering a channel or time slot with naturally longer resolution times? Slow doesn't always mean underperforming. Sometimes it means someone's quietly absorbing your hardest cases, and the report just doesn't show ticket complexity.
Time-of-day spikes. Lunch gaps, end-of-day dead zones, and weekend silence often show up clearly once you're looking at the data over a week or two. These usually point to coverage holes rather than a training issue, but confirm your team's actual working hours and any bank holidays in that window before reading too much into a single week's dip.
Conversations stuck waiting on someone else. This is where internal notes and tagging earn their keep. If you tag a ticket "waiting on engineering" and it sits there for two days, check whether that's a genuine cross-team bottleneck or whether the tag itself is stale and the work actually finished without anyone updating it. Reports are only as accurate as the tagging discipline behind them.
What's a good first response time benchmark for a small team?
This is where a lot of small teams go wrong, and I don't blame them for it. Most of the benchmark advice floating around online was written by people running support for companies with 50+ agents and dedicated shift coverage, often based in the US with different working-hour norms. Applying a sub-5-minute chat SLA to a 2-person UK team is a great way to feel like you're failing every single day, even when you're doing genuinely great work.
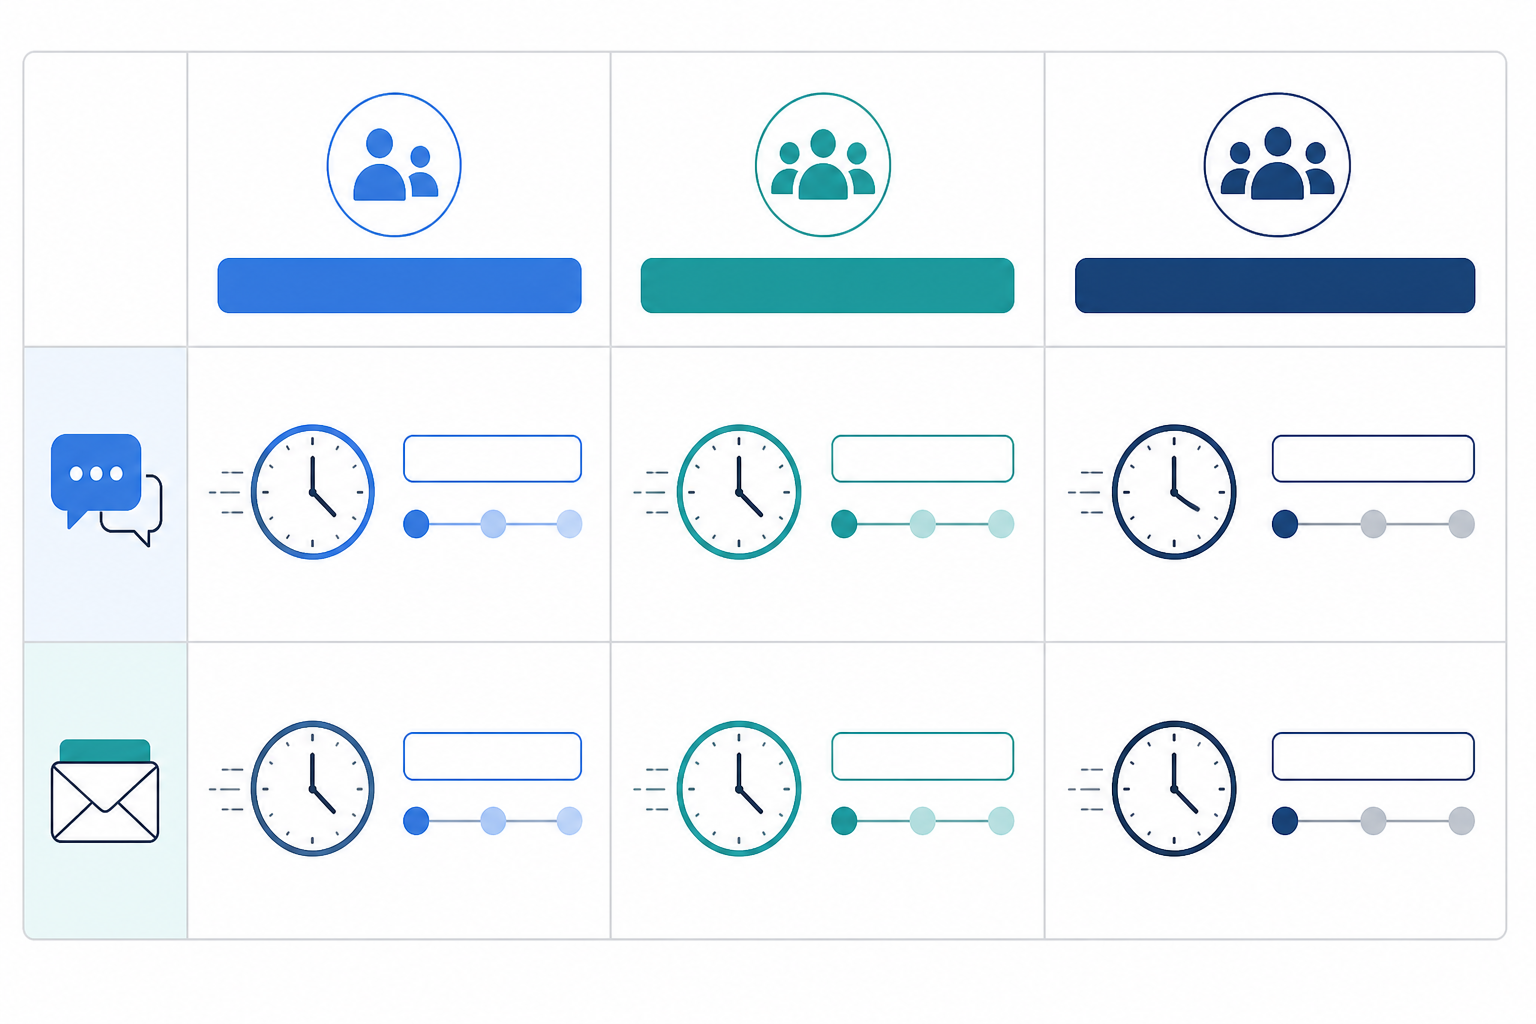
The table below is a set of illustrative starting targets, not an industry standard, and there's no single authoritative source for what a "good" number looks like across every business. Treat these as a reasonable first attempt to adjust once you've measured your own baseline for three or four weeks. They also assume business-hours coverage (typically 9am to 5pm, Monday to Friday, excluding bank holidays) rather than 24/7 calendar-time coverage, and they're rough averages rather than medians, so a few very slow tickets can pull your own number higher than you'd expect.
| Team size | Live chat FRT starting target | Email FRT starting target |
|---|---|---|
| Solo founder or 1-2 people | Under 4 business hours | Same business day |
| 3-5 person team | Under 1 hour | Under 4 business hours |
| 6-10 person team (with automation or AI copilot support) | Under 15 minutes | Under 2 business hours |
A couple of things worth calling out here. If you're a solo founder answering support tickets between everything else you're doing to run the business, under 4 business hours on chat is genuinely solid, not a sign you need to apologise to customers. If you're supporting customers across multiple time zones, you'll want to define what "business hours" means for your coverage before these targets mean much at all. As your team grows and you add some automation, an AI copilot trained on your docs, or just more hands on deck, those numbers should tighten naturally. It's worth checking them again once a quarter rather than assuming January's targets still apply in June.
One structural factor worth mentioning: pricing models can influence how teams set these targets. If your support software charges per seat, there's a temptation to stretch benchmarks thin rather than add headcount, which tends to burn people out. Flat-rate pricing with unlimited agents, which is how Sonny is priced, removes that particular pressure, since adding someone during a busy season doesn't change your bill. Worth checking how your own tool is priced if you notice this tension.
How to turn help desk reports into weekly team habits
A report nobody looks at is worse than no report at all, because now you've got the data and you're still not using it. Here's how I'd build the habit without it turning into a chore.
- Pick one 15-minute slot each week, and assign an owner. Monday morning tends to work well since it sets the tone for the week and you're looking at fresh weekend or Friday data. Put it on the calendar like any other recurring meeting, and rotate who owns pulling up the numbers so it isn't always the same person's job.
- Ask three questions, every time. Did response times get better or worse than last week? Which channel needs attention right now? Is anyone on the team quietly overloaded? Keep the questions the same each week so the habit sticks and nobody's reinventing the meeting from scratch.
- Celebrate small wins out loud. Even a 10-minute improvement in resolution time is worth mentioning to the team. Support work is often thankless, and pointing at a real number that improved because of something someone did is a nice, low-effort way to build morale.
- Set one adjustable target for the coming week, with a named owner and a follow-up date. Not a permanent rule carved in stone, just a focus. Maybe it's "let's get email FRT under 3 hours this week, and I'll check back Friday" or "let's clear the Friday afternoon backlog before it rolls into Monday, and Sam owns that." Naming who's responsible and when you'll revisit it is what turns a good intention into something that actually happens.
- Revisit your benchmarks every quarter. As your team grows or adds tools like tagging automation or an AI copilot, this quarter's "good" number becomes next quarter's baseline. Don't assume the targets you set in January still make sense in June.
The teams that stick with this longest tend to treat it as a conversation, not a report card. You're not grading anyone. You're just looking at the same three numbers together, regularly, so small problems get caught before they turn into a pattern of unhappy customers.
Frequently asked questions about help desk software metrics
What support metrics should a small team track first, and why not more?
Start with three: first response time, resolution time, and ticket volume by channel. The reason to stop there isn't that other metrics don't matter, it's that a small team's reporting habit needs to survive contact with a busy week. Metrics like customer satisfaction scores or reopened ticket rates are genuinely useful additions once these three feel automatic, typically after a few months of consistent tracking.
Are these benchmark figures averages or medians, and does that matter?
The targets in this article are rough averages based on business-hours coverage, not medians, and not drawn from a single authoritative industry source. That distinction matters because averages get pulled upward by a handful of very slow tickets, so your "typical" ticket might actually be faster than your average suggests. If your help desk software lets you view the median alongside the average, look at both before deciding your team is underperforming.
Does a bot's automatic reply count towards first response time?
It depends entirely on how your help desk software is configured, and this is worth checking rather than assuming. Some tools count any reply, including automated ones, towards FRT, which can make your numbers look better than the actual human response speed customers are experiencing. Where possible, check whether you can measure time to first human response separately, since that's usually the more honest number to build habits around.
How often should I review support metrics as a small team?
Weekly is the sweet spot for most small teams. Daily checks tend to cause overreaction to normal variation, while monthly reviews mean problems fester too long before anyone notices. A quick 15-minute weekly look, tied to the same few questions and a named owner, keeps everyone accountable without turning into a chore.